
As part of my collaboration with my former partners from my old company, this month I had to prepare the KPI proposal I believe they should review in a monthly meeting.
They needed KPIs for each company in the group, which are:
- Yo pongo el hielo: my former company and its digital channel, an ecommerce business selling food and drinks.
- YPH Mayoristas and TDL: the companies serving the HORECA channel (bars, restaurants, pubs, etc.).
- Sanluma: the physical stores, which are pivoting into distributors (moving from B2C to B2B).
- Grupo ComenXall: the holding company that brings them all together.
So, I got to work and came up with this:
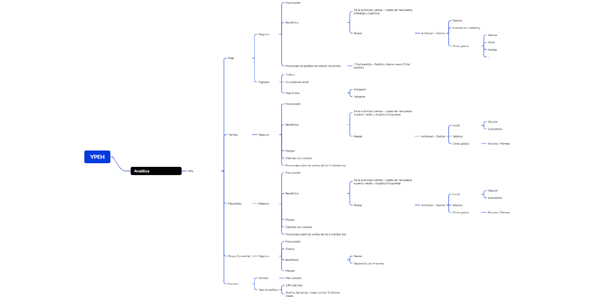
The image is small, so you cannot see it properly. Do not worry, I will explain it now.
Real example of business KPIs
Let us start with the real example and then I will explain the process.
In this case, the KPIs for each business are as follows:
Yo pongo el hielo: two types of KPIs, business and digital, specific to the channel.
- Business KPIs
- Revenue
- Beneficios
- De la actividad (ventas – costes de mercadería, embalaje y logística)
- Reales (Actividad – Gastos [Salarios, Inversión en marketing, Otros gastos])
- Percentage of orders from returning customers: (Total orders – New customer orders) / Total orders
- Digital KPIs
- Traffic
- Suscriptores email
- Instagram followers
- Telegram
YPH Mayoristas and TDL: here we no longer separate them. Since there is no physical sales channel as such (everything is done through calls, WhatsApp or email), we leave out the number of store visitors and similar things, to focus on the business:
- Revenue
- Operating profit (sales − cost of goods at average price − van logistics)
- Net profit (operating profit − expenses [rent, utilities, salaries, breakage/shrinkage and other expenses])
Sanluma: as it is moving towards a model similar to the other two companies, I think it makes sense to measure its performance with the same KPIs, so I will not repeat them.
Grupo ComenXall: here the aim is to view the company as a whole. To do that, we will look at:
- Revenue
- Expenses
- Net profit
- Broken down by company
In the first three cases, the data update frequency will be monthly, while in the last case it will be quarterly.
The reason?
I will explain it now, by walking you through the variables I considered and the process I followed to reach this proposal.
General variables
At this point we are going to look at the two aspects that make me choose one variable over another when selecting a metric as a KPI.
These are the two main elements in the equation and, although we will later refine them with two others, what I explain here will define most of the selection.
Value of the information provided
This is the key point.
A KPI is a metric that triggers action as soon as it deviates from its targets.
In general, these are indicators that meet one of these three criteria:
- They affect margin (more revenue or lower expenses).
- They measure risk (future margin, really).
- They determine budget allocation.
So, to define KPIs based on the information they provide, I ask myself guiding questions such as:
- What happens if the metric falls? Would it change my priorities or those of the business?
- Or this one: how often will I review it? Daily, weekly or monthly?
- And how critical is its measurement? What is the cost of error if the KPI is wrong?
Examples of high-value metrics:
- Operating margin (operating revenue minus operating expenses).
- Actual margin (all revenue minus all expenses).
- Contribution margin by channel or category.
- 12-month LTV/CAC.
- Customer repeat-purchase rate.
- Churn.
- NPS.
- Marketing channel incrementality. Or at least attribution.
- …
As you can see, there is a bit of everything, but every one of them helps us understand the margin generated by the project or assess risks (NPS, churn…).
Difficulty of extracting the data
If you look at the previous metrics, you will see that some are very easy to obtain because the CMS or ERP provides them by default (margin, customer repeat rate).
However, others will be much harder to obtain (incrementality or attribution).
That is why, when setting metrics, we must consider whether we will be able to extract them properly. We will find ourselves in one of these three scenarios::
- Whether implementing our current tools is enough.
- Whether something needs to be developed in our technology stack.
- Whether new platforms need to be implemented.
No matter how much value a data point provides, if we cannot obtain it in the short term, selecting it from the outset is pointless. That is why I later discuss the analytics roadmap, where we face several scenarios.
And how do I know how difficult a data point is to extract?
Through experience, while also considering things like these:
- Low difficulty: one stable source (GSC for CTR; ERP for cost).
- Medium: two sources with a simple join (GA4 + ERP for the actual conversion rate).
- High: in-depth analysis using several sources. Cohorts/attribution/incrementality (actual LTV, incremental ROAS).
It may sound obvious, but keep the two variables we just discussed in mind and, when selecting KPIs, start with High value + Low difficulty (there is always at least one).
Bear in mind that High value + High difficulty metrics only become KPIs if you can develop a solution to obtain them, with everything that entails (defining the development, executing it, maintaining it and QA).
Specific variables
Right, once we have the above as our foundation, every KPI must pass through two more filters.
These new variables refine the information I want to convey, which may be more basic or general, or much more specific or complex, depending on each case.
Role: who the KPI is intended for
I assume this is clear, but although they sound similar, a company CEO does not need the same thing as an SEO specialist.
The CEO seeks a view of the business and its risks, so their metrics will generally be higher-level and less specific:
- Operating and contribution margin.
- Revenue.
- Market share.
- NPS.
- Churn.
The department head (Marketing/IT/Product/Ops) needs the most relevant metrics for their department. In marketing, for example, these might be:
- CAC.
- Advertising spend.
- Attribution by channel.
Middle managers must combine the KPIs of their department head with the team's KPIs. Yes, you need to know all of them. Or almost all.
The specialist (SEO, Paid, CRM, Data) needs maximum specificity. They know the business depends on their KPIs working. For someone in paid media, these could be:
- CAC for their channel.
- Number of conversions.
- Share of conversions.
- Conversion rate.
- Landing page bounce rate.
- Spend per campaign.
I think the examples above make it very clear what each role needs.
Analytics maturity
When you face a project like this, you must be clear about who it is intended for, not only according to their role, but also their experience working with data.
Presenting KPIs to someone with years of experience reading dashboards is not the same as presenting them to an analytics newbie .
That is why, if certain metrics are difficult to explain or understand, it is often better to leave them out. Even if you explain them well, when the KPI is updated a month later, the person extracting or interpreting it may not do so correctly.
In these cases, stick to simpler, easier-to-understand metrics..
You can try proposing one or two advanced ones, but no more.
This is exactly the case with Yo pongo el hielo. Review the KPIs at the beginning again and you will see it.
In the opposite case, with experienced staff, you can use simple metrics where appropriate, but you will also have the freedom to use more complex metrics when you consider them relevant.
Recommended number of KPIs and review frequency
Let us get straight to the point.
If they are the KPIs for an entire company, between 4 and 7 is reasonable.
If they are for a department or individual, between 3 and 5.
No more.
If you want to add more values, you should treat them as important metrics or supporting diagnostic metrics, but not KPIs.
In fact, in my ecommerce analytics course I propose the 17 KPIs needed to keep your store under control. You may say that 17 is more than the 7 I mention here, but those 17 cover every department in the company. Hence the number.
As for the frequency with which the data should be reviewed, we have several levels:
- Daily for performance/ops (daily net revenue, critical stock, checkout errors, latency).
- Monthly frequency: metrics that help you understand project progress and reallocate resources (margin, AOV, retention, CAC by audience, experiment velocity, data health).
- Quarterly frequency: for strategic insight (6–12-month LTV/CAC, incrementality, profitability mix by category/country, churn by cohort).
Roadmap: always work across 2–3 levels
The normal approach is to begin with a relatively broad list of possible KPIs based on the two fundamental variables (information and difficulty).
From there, filter using the remaining secondary variables, until you reach the number mentioned above (3–5 per department).
Once you have defined the KPIs for all departments involved, divide them into two or three scenarios to begin using them:
- Essential KPIs: those that will start being used immediately. This means most will be easy to extract, although we can add one or two more complex ones that require development.
- Desirable KPIs: those that provide a more specific view. They generally require more complex analyses or technical implementations we do not yet have. Once the process for extracting the essential ones is established, we will move on to these.
- Optimal KPIs: once you have everything needed, you aim for top marks. These are companies with mature analytics, where an occasional KPI is added to optimize an area considered improvable, but not seriously so (otherwise it would have been addressed earlier).
Starting this way, from simple to complex, lets you see, demonstrate and extract value from analytics from day one, while gradually embedding the value of data in the organization.
Visualization: dashboards that force action
Dashboards are the next step after selecting KPIs.
It means deciding on the best way to display them:
- Bar or line chart: good for showing trends over time
- Combined chart: to combine two KPIs and show how they evolve over time, for example website traffic and revenue.
- KPI value: the standalone figure (without a trend), compared with the previous year or last month.
- Pie chart: please do not use it. And if you do, use no more than 3 clearly differentiated values.
- Table: useful for presenting certain information, such as the most visited URLs or best-selling products…
You should know that the dashboard creation process will be (or should be) manual at first, so it can be shown to the relevant person, who can suggest possible changes, and automated once everything is OK.
Conclusions and next steps
A short article (by my standards), straight to the point.
So that the process of choosing KPIs for your project is clear.
Before wrapping up, one piece of advice:
Stick to a small number of indicators, but make sure they have high information value, can be extracted relatively easily and encourage clear action when they turn red. Assign someone responsible for the data, who will explain it, and the person who will extract it (not necessarily the same person), with a defined frequency.
If you achieve that, you will have control over your business, department or specialty. It is that simple.
There is a clear before and after once you start tracking KPIs against your objectives.
The good thing is that the sooner you begin, the faster you will get the hang of it and see its usefulness.
If this approach works for you, I invite you to subscribe to my newsletter right here to receive practical guides like this one (no fluff, just actionable advice) and to follow my YouTube channel, where I publish guides, real cases and step-by-step tutorials.
Frequently asked questions
How many KPIs should my project have?
4–7 for the whole company and 3–5 per department. The rest are supporting metrics.
What should I do if a KPI is high-value but difficult to measure?
Only make it a KPI if there is a data project that guarantees a single definition, an owner and QA. Until then, treat it as a supporting metric.
How often should I review KPIs?
Weekly/monthly monitoring and a quarterly review to remove or add metrics according to strategy and data quality.
Should they be the same for CEOs and specialists?
No. The data they need for their work differs, although some KPIs may overlap.

Leave a Reply